05-Reduced Dimension Embeddings
UMAP Embeddings
import numpy as np
import pandas as pd
import xarray as xr
import umap
import umap.plot
import GSForge as gsf
import holoviews as hv
import matplotlib.pyplot as plt
hv.extension("bokeh")
# OS-independent path management.
from os import  environ
from pathlib import Path
OSF_PATH = Path(environ.get("GSFORGE_DEMO_DATA", default="~/GSForge_demo_data/")).expanduser().joinpath("osfstorage", "oryza_sativa")
NORMED_GEM_PATH = OSF_PATH.joinpath("AnnotatedGEMs", "oryza_sativa_hisat2_normed.nc")
agem = gsf.AnnotatedGEM(NORMED_GEM_PATH)
agem
<GSForge.AnnotatedGEM>
Name: Oryza sativa
Selected GEM Variable: 'counts'
    Gene   55986
    Sample 475
agem.count_array_names
['counts',
 'TPM_counts',
 'uq_raw_counts',
 'uq_tpm_counts',
 'quantile_counts',
 'tmm_counts']
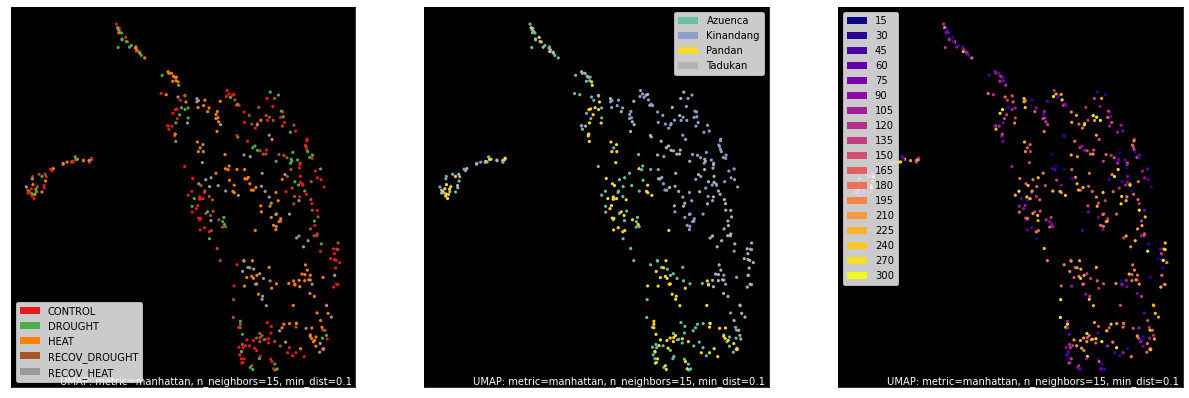
counts, labels = gsf.get_gem_data(agem, annotation_variables=['treatment', 'genotype', 'time'])
mapper = umap.UMAP(random_state=50, metric='manhattan').fit(counts.values)
fig, axes = plt.subplots(1, 3, figsize=(21, 7))
umap.plot.points(mapper, labels=labels['treatment'], background='black', ax=axes[0], color_key_cmap='Set1');
umap.plot.points(mapper, labels=labels['genotype'], background='black', ax=axes[1], color_key_cmap='Set2');
umap.plot.points(mapper, labels=labels['time'], background='black', ax=axes[2], color_key_cmap='plasma');
<AxesSubplot:>
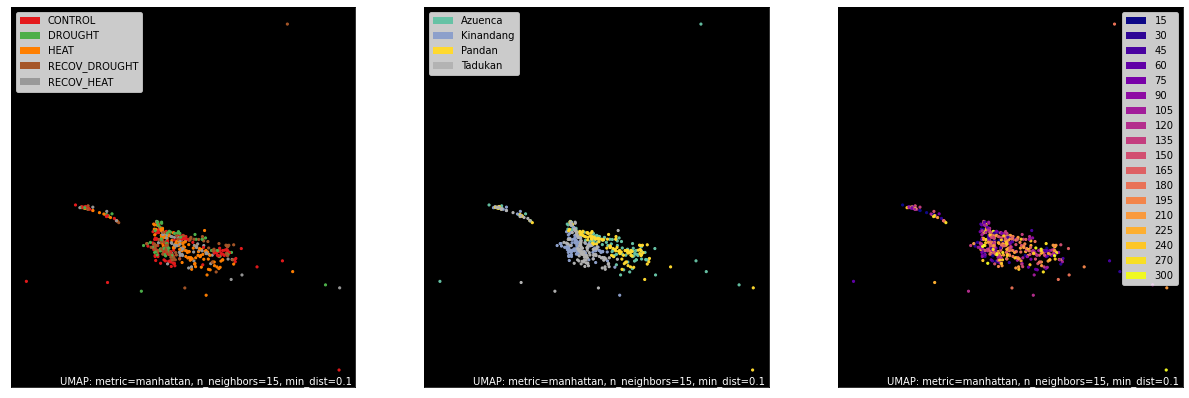
counts, labels = gsf.get_gem_data(agem, annotation_variables=['treatment', 'genotype', 'time'])
mapper = umap.UMAP(densmap=True, random_state=50, metric='manhattan').fit(counts.values)
fig, axes = plt.subplots(1, 3, figsize=(21, 7))
umap.plot.points(mapper, labels=labels['treatment'], background='black', ax=axes[0], color_key_cmap='Set1');
umap.plot.points(mapper, labels=labels['genotype'], background='black', ax=axes[1], color_key_cmap='Set2');
umap.plot.points(mapper, labels=labels['time'], background='black', ax=axes[2], color_key_cmap='plasma');
<AxesSubplot:>
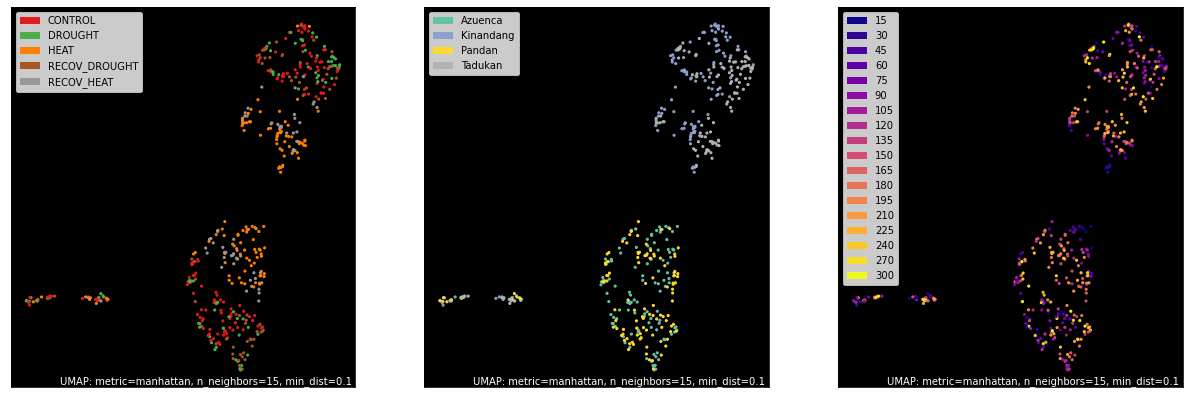
TPM Counts
counts, labels = gsf.get_gem_data(agem, annotation_variables=['treatment', 'genotype', 'time'], count_variable='TPM_counts')
mapper = umap.UMAP(random_state=66, metric='manhattan').fit(counts.values)
fig, axes = plt.subplots(1, 3, figsize=(21, 7))
umap.plot.points(mapper, labels=labels['treatment'], background='black', ax=axes[0], color_key_cmap='Set1');
umap.plot.points(mapper, labels=labels['genotype'], background='black', ax=axes[1], color_key_cmap='Set2');
umap.plot.points(mapper, labels=labels['time'], background='black', ax=axes[2], color_key_cmap='plasma');
<AxesSubplot:>
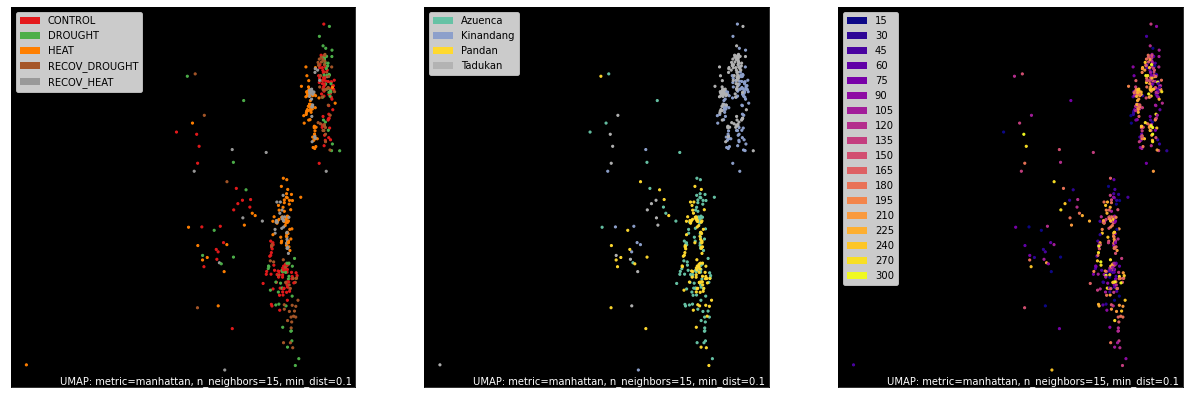
counts, labels = gsf.get_gem_data(agem, annotation_variables=['treatment', 'genotype', 'time'], count_variable='TPM_counts')
mapper = umap.UMAP(densmap=True, random_state=95, metric='manhattan').fit(counts.values)
fig, axes = plt.subplots(1, 3, figsize=(21, 7))
umap.plot.points(mapper, labels=labels['treatment'], background='black', ax=axes[0], color_key_cmap='Set1');
umap.plot.points(mapper, labels=labels['genotype'], background='black', ax=axes[1], color_key_cmap='Set2');
umap.plot.points(mapper, labels=labels['time'], background='black', ax=axes[2], color_key_cmap='plasma');
<AxesSubplot:>
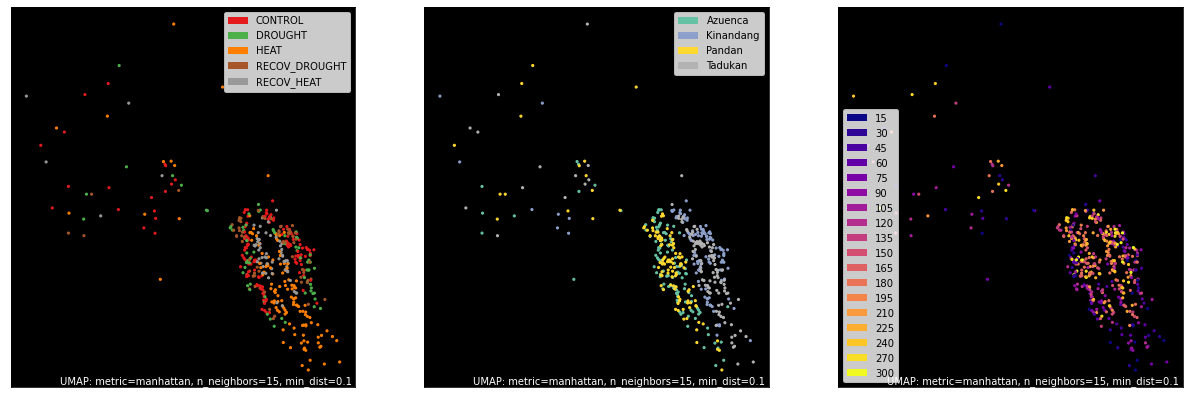
TMM Counts
counts, labels = gsf.get_gem_data(agem, annotation_variables=['treatment', 'genotype', 'time'], count_variable='tmm_counts')
mapper = umap.UMAP(densmap=True, random_state=50, metric='manhattan').fit(counts.values)
fig, axes = plt.subplots(1, 3, figsize=(21, 7))
umap.plot.points(mapper, labels=labels['treatment'], background='black', ax=axes[0], color_key_cmap='Set1');
umap.plot.points(mapper, labels=labels['genotype'], background='black', ax=axes[1], color_key_cmap='Set2');
umap.plot.points(mapper, labels=labels['time'], background='black', ax=axes[2], color_key_cmap='plasma');
<AxesSubplot:>
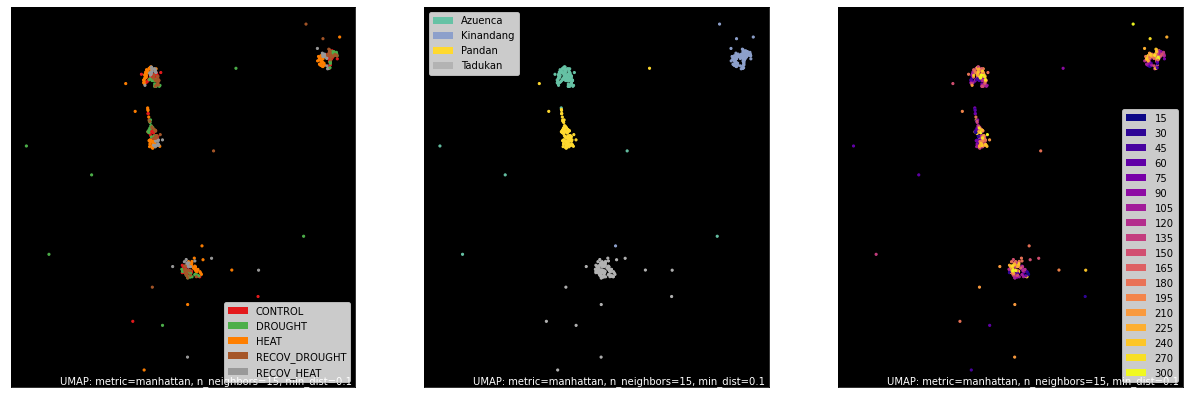
Quantile Transformed
counts, labels = gsf.get_gem_data(agem, annotation_variables=['treatment', 'genotype', 'time'], count_variable='quantile_counts')
mapper = umap.UMAP(densmap=True, random_state=50, metric='manhattan').fit(counts.values)
fig, axes = plt.subplots(1, 3, figsize=(21, 7))
umap.plot.points(mapper, labels=labels['treatment'], background='black', ax=axes[0], color_key_cmap='Set1');
umap.plot.points(mapper, labels=labels['genotype'], background='black', ax=axes[1], color_key_cmap='Set2');
umap.plot.points(mapper, labels=labels['time'], background='black', ax=axes[2], color_key_cmap='plasma');
<AxesSubplot:>
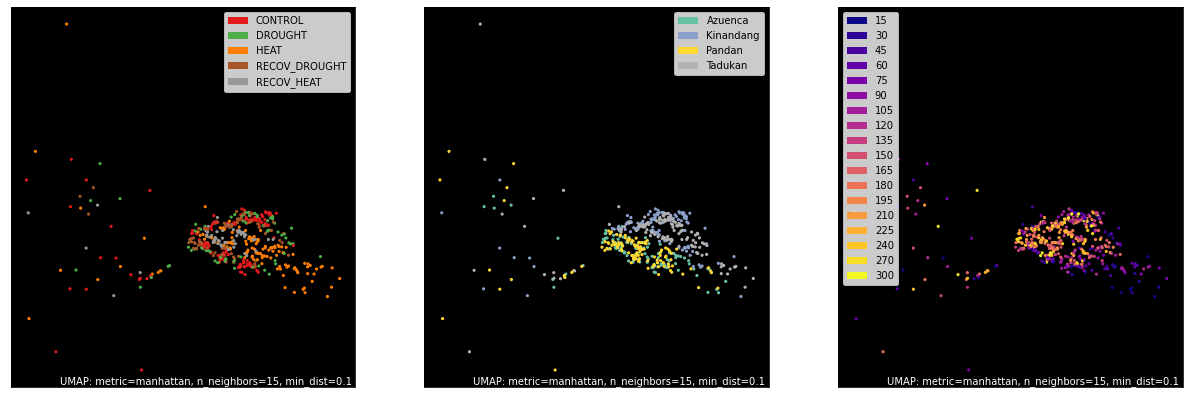
Upper Quantile of Raw
counts, labels = gsf.get_gem_data(agem, annotation_variables=['treatment', 'genotype', 'time'], count_variable='uq_raw_counts')
mapper = umap.UMAP(densmap=True, random_state=50, metric='manhattan').fit(counts.values)
fig, axes = plt.subplots(1, 3, figsize=(21, 7))
umap.plot.points(mapper, labels=labels['treatment'], background='black', ax=axes[0], color_key_cmap='Set1');
umap.plot.points(mapper, labels=labels['genotype'], background='black', ax=axes[1], color_key_cmap='Set2');
umap.plot.points(mapper, labels=labels['time'], background='black', ax=axes[2], color_key_cmap='plasma');
<AxesSubplot:>
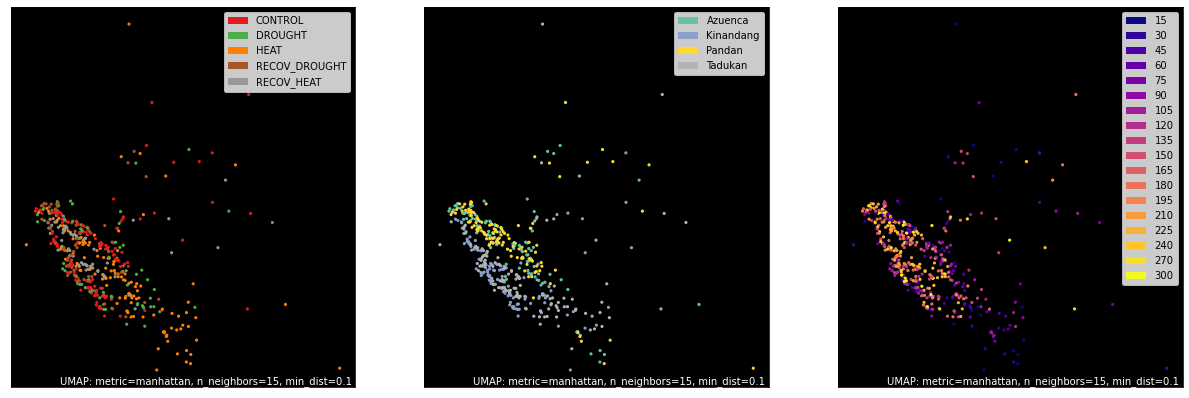
Upper Quantile of TPM
counts, labels = gsf.get_gem_data(agem, annotation_variables=['treatment', 'genotype', 'time'], count_variable='uq_tpm_counts')
mapper = umap.UMAP(densmap=True, random_state=50, metric='manhattan').fit(counts.values)
fig, axes = plt.subplots(1, 3, figsize=(21, 7))
umap.plot.points(mapper, labels=labels['treatment'], background='black', ax=axes[0], color_key_cmap='Set1');
umap.plot.points(mapper, labels=labels['genotype'], background='black', ax=axes[1], color_key_cmap='Set2');
umap.plot.points(mapper, labels=labels['time'], background='black', ax=axes[2], color_key_cmap='plasma');
<AxesSubplot:>
# counts, labels = gsf.get_gem_data(agem, annotation_variables=['treatment', 'genotype', 'time'], count_variable='TPM_counts')
# mapper = umap.UMAP(densmap=True, random_state=66, metric='manhattan').fit(counts.values)
# fig, axes = plt.subplots(1, 2, figsize=(10, 5), dpi=300)
# umap.plot.points(mapper, labels=labels['treatment'], background='black', ax=axes[0], color_key_cmap='Set1');
# umap.plot.points(mapper, labels=labels['genotype'], background='black', ax=axes[1], color_key_cmap='Set2');
# umap.plot.points(mapper, labels=labels['time'], background='black', ax=axes[2], color_key_cmap='plasma');
# treatments = labels['treatment'].to_series().unique()
# treatment_colors = hv.plotting.util.process_cmap('tab10', ncolors=len(treatments), categorical=True)
# treatment_cmap = {g: c for g, c in zip(treatments, treatment_colors)}
# treatment_cmap = {
#     'CONTROL': '#1f78b4',
#     'HEAT': '#e31a1c',
#     'RECOV_HEAT': '#fb9a99',
#     'DROUGHT': '#6a3d9a',
#     'RECOV_DROUGHT': '#cab2d6',
# }
# # treatment_cmap

# times = labels['time'].to_series().unique()
# time_colors = hv.plotting.util.process_cmap('viridis', ncolors=len(times), categorical=False)
# time_cmap = {g: c for g, c in zip(times, time_colors)}

# plt.rcParams.update({'font.size': 10, 'font.family': 'serif'})
# # counts, labels = gsf.get_gem_data(agem, annotation_variables=['treatment', 'genotype', 'time'], count_variable='TPM_counts',
# #                                   count_transform=lambda c: np.log2(c + 0.25))
# # mapper = umap.UMAP(random_state=42, metric='manhattan', densmap=False, n_neighbors=50).fit(counts.values)


# fig_inches = 3.5
# fig_dpi = 300
# fig_pixels = int(fig_inches * fig_dpi)

# fig, axes = plt.subplots(figsize=(fig_inches, fig_inches), dpi=fig_dpi)


# # colors = labels['treatment'].to_series().map(treatment_cmap).values
# # colors = labels['time'].to_series().map(time_cmap).values
# colors = labels['genotype'].to_series().map(genotype_cmap).values


# axes.scatter(mapper.embedding_[:, 0], mapper.embedding_[:, 1], s=10, marker='.', linewidths=0, c=colors);


# axes.xaxis.set_visible(False)
# axes.yaxis.set_visible(False)

# for spine in axes.spines.values():
#     spine.set_edgecolor('grey')
#     spine.set_linewidth(0.5)

# fig, axes = plt.subplots(dpi=fig_dpi, figsize=(3, 0.75))
# axes.axis('off')
# handles = [mpatches.Patch(color=c, label=k) for k, c in genotype_cmap.items()]
# axes.legend(handles=handles, ncol=2);